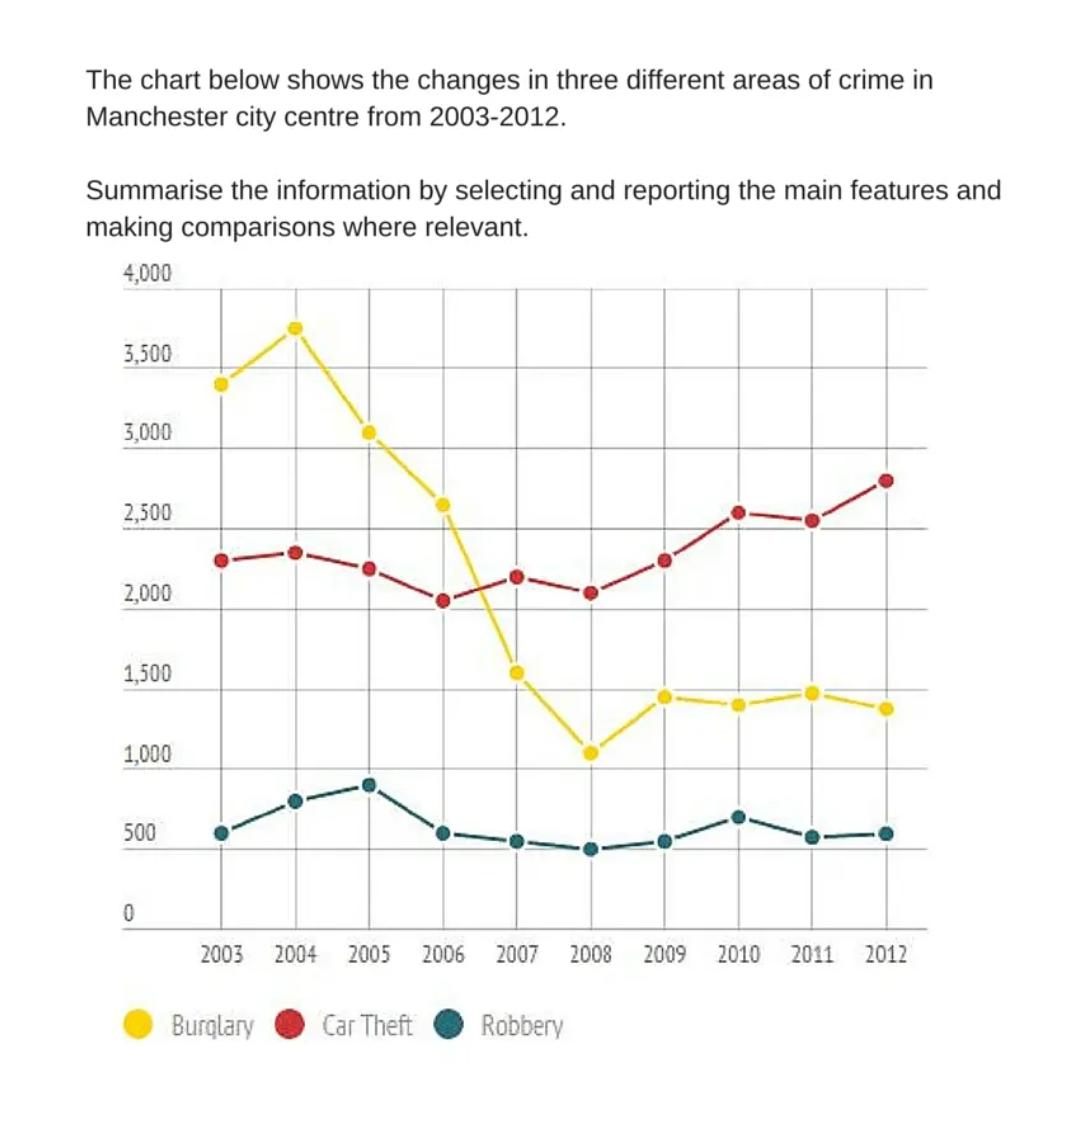
The provides line graph gives information on the changes in three different areas of crime in Manchester city centre from 2003 to 2012. Overall, the yellow line represents burglary crime which it falls sharply during the years, the yellow line shows car theft accidents and it rises slightly in this statistic.
But the blue line illustrates robbery which it fluctuates minimally in the given chart. To begin, burglary incident reached to the top in 2004, It was approximately 3700 then it decreased rapidly through the chart. We can see that it has been quite stable for last 4 years and almost have not any change.
This statistic gives a positive message for name of humanity. However, the situation is so stable in car theft and robbery accidents than burglary, so they exist slightly changes during the years. A rise is felt slightly in cat theft statistic from 2006 to 2012 and Robbery crimes have stayed stable in the same years.