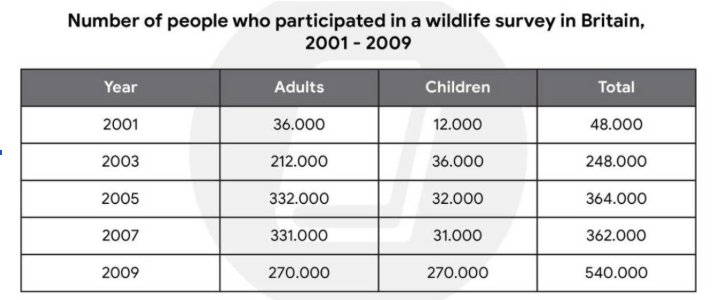
The given table illustrates the quantities of adults and children who took part in a wildlife survey in Britain between 2001 and 2009, as well as the data of total participants.
Overall, the most striking feature when looking at the data is the consistent growth in the total participation in this British survey in almost all of the provided period, except for a minimal decline in 2007. It is also important to note that adults made up the vast majority of the overall participation; however, this number was caught up by children in 2009.
As for the period from 2001 to 2005, the participation in the wildlife survey experienced substantial growth, with the overall figures rising more than sevenfold from 48. 000 to 364. 000. Particularly, adults was primarily driven for this upward trends, rising dramatically from 36. 000 in 2001 to 212. 000 in 2003 and then reached 332. 000 by 2005. Children, however, witnessed relatively low during this period, increasing from 12. 000 in 2001 to 36. 000 in 2003 before declining moderately to 32. 000 by 2005. Turning to the latter period (2007-2009), there was a marginal change in the surveyed population between 2005 and 2007, with the overall figure slipping from 364. 000 to 362. 000.
The total number of attendees remained stable in 2007 at 362. 000. During this period, adults was over ten times higher than that of children, with figures of 331. 000 and 31. 000, respectively. At the end of the period, specifically, although the influx of adults’ engagement fell to 270. 000, minor attendees surged to a similar figure. As a result, the British surveyed population skyrocketed to a clear of 540. 000, the highest number recorded during this period.